- Posts: 114
- Thank you received: 8
Question CT 6.7 freezes while debugging
- universe
-
Topic Author
- Offline
- Junior Member
-
I noticed that CT6.7 freezes randomly after debugging the application (Still I can see the application launched in process manager). But the IDE won't execute any further action while the Pause Button is disabled.
Any hints?
CT6.7 32bit on Windows 7 64bit
Thanks.
Please Log in or Create an account to join the conversation.
- Matis A.
-
- Away
- Moderator
-
your project or a sample project with the problem, etc...
PilotLogic Core Programmer
Please Log in or Create an account to join the conversation.
- universe
-
Topic Author
- Offline
- Junior Member
-
- Posts: 114
- Thank you received: 8
I am not able to reproduce it, meanwhile I was looking for a hint, a log message generated by the IDE while debugger has been launched. I see the IDE displaying (debugging...) and the stop button is red and that's all. There is no crash or anything else, it just stops this way.
Please Log in or Create an account to join the conversation.
- Peter Heckert
-
- Offline
- Junior Member
-
- Posts: 62
- Thank you received: 3
(I dont remember if this was with Typhon or another (C++) IDE.)
This overloads the windows message pump.
As a result neither the debugger nor the debugee can process input events, they "freeze".
If it happens again watch the CPU usage in Task Manager, possibly one Core is at 100%.
Please Log in or Create an account to join the conversation.
- universe
-
Topic Author
- Offline
- Junior Member
-
- Posts: 114
- Thank you received: 8
Please Log in or Create an account to join the conversation.
- universe
-
Topic Author
- Offline
- Junior Member
-
- Posts: 114
- Thank you received: 8
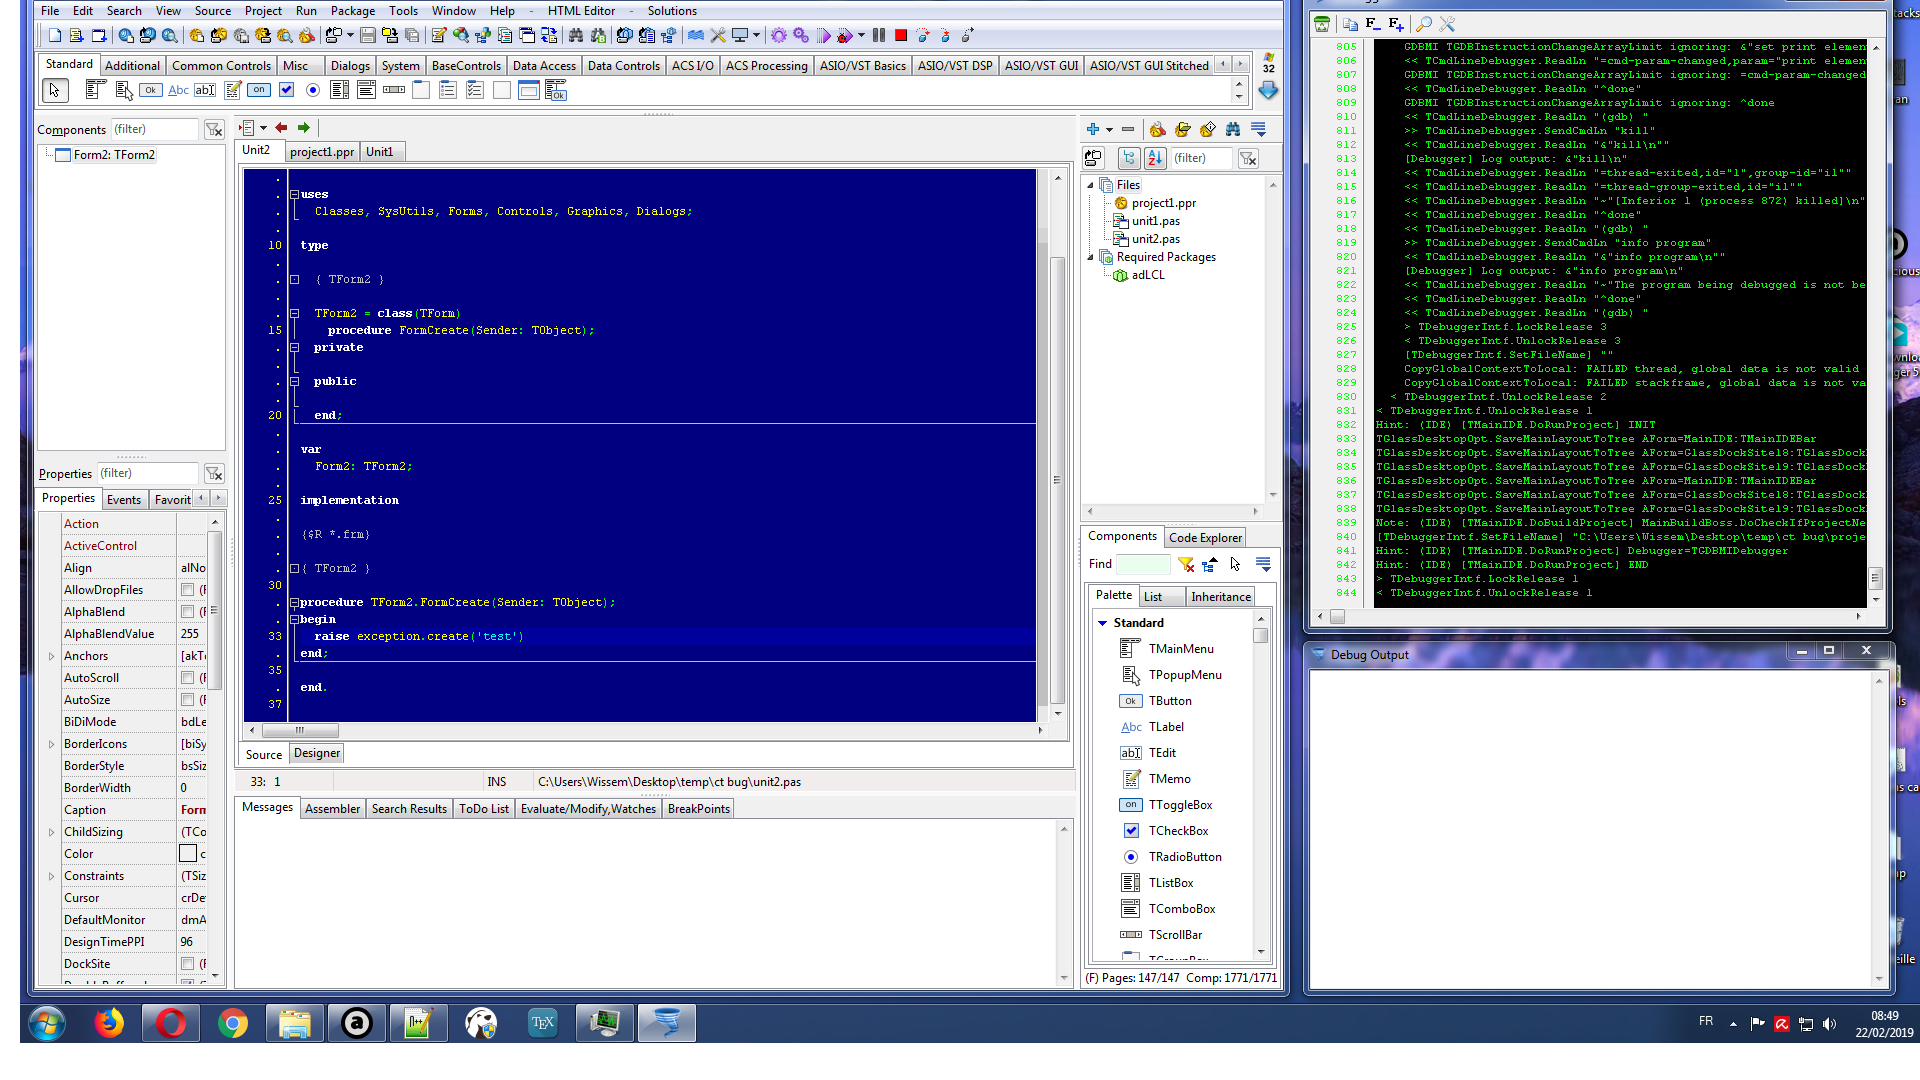
1. Start new project.
1. Add
raise exception.Create('test');
2. Start debugging
3. When IDE raise the exception click on break.
4. Click on Stop button.
5. Start debugging, IDE will freeze.
Please Log in or Create an account to join the conversation.
- Peter Heckert
-
- Offline
- Junior Member
-
- Posts: 62
- Thank you received: 3
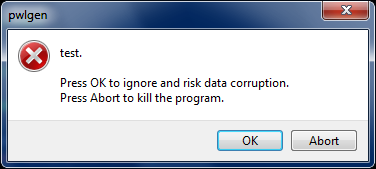
It didnt freeze, but after some singlesteps a warning message appears.
See Attachment.
Addendum: I use CTLAB 6.8, not 6.7
There are debugging problems in 6.8, (and in 6.7) such as the assembler window popping up.
These problems appear preferrably but not exclusively if a breakpoint is set in a routine that is called before the main loop of the program is entered.
Addendum2:
I tested this again with CTLAB6.8 32 Bit on 64 Bit Windows 10. Same Result.
Attachments:
Please Log in or Create an account to join the conversation.
- universe
-
Topic Author
- Offline
- Junior Member
-
- Posts: 114
- Thank you received: 8
Please Log in or Create an account to join the conversation.
- universe
-
Topic Author
- Offline
- Junior Member
-
- Posts: 114
- Thank you received: 8
Please Log in or Create an account to join the conversation.
- Peter Heckert
-
- Offline
- Junior Member
-
- Posts: 62
- Thank you received: 3
After the exception was raised and ignored by me, the window appeared, and debugging was possible as usual.
No freeze and no crash here.
Please Log in or Create an account to join the conversation.
- universe
-
Topic Author
- Offline
- Junior Member
-
- Posts: 114
- Thank you received: 8
Please Log in or Create an account to join the conversation.
- universe
-
Topic Author
- Offline
- Junior Member
-
- Posts: 114
- Thank you received: 8
Attachments:
Please Log in or Create an account to join the conversation.
- Peter Heckert
-
- Offline
- Junior Member
-
- Posts: 62
- Thank you received: 3
universe wrote: Thanks for the test did you press on the stop while the exception is raised by IDE then start debugging again?
I am on Win7 32 Bit this morning and tried again with CT6.8.
When the exception window pops up then I have two options, Break and Continue.
I tried both, I clicked the red stop button, I tried various forms of singlestep and restarted the debugger several times.
I was not able to reproduce the problem.
BTW, I have seen a directoryname "ct bug" in this screenshot. Could there be a problem with spaces in paths or unusual characters? The GNU tools do not like this.
Here the log from today morning.
Hint: (IDE) [TMainIDE.DoRunProject] INIT
TGlassDesktopOpt.SaveMainLayoutToTree AForm=MainIDE:TMainIDEBar
TGlassDesktopOpt.SaveMainLayoutToTree AForm=GlassDockSite7:TGlassDockHostSite
TGlassDesktopOpt.SaveMainLayoutToTree AForm=MainIDE:TMainIDEBar
TGlassDesktopOpt.SaveMainLayoutToTree AForm=GlassDockSite7:TGlassDockHostSite
Note: (IDE) [TMainIDE.DoBuildProject] MainBuildBoss.DoCheckIfProjectNeedsCompilation nothing to be done
Hint: (IDE) [TMainIDE.DoRunProject] Debugger=TGDBMIDebugger
Hint: (IDE) [TMainIDE.DoRunProject] END
TGDBMIDebugger.StartDebugging WorkingDir="C:\Users\peter\Desktop\TestProj\"
Please Log in or Create an account to join the conversation.
- universe
-
Topic Author
- Offline
- Junior Member
-
- Posts: 114
- Thank you received: 8
Edit: I think I have to test with CT6.8
Please Log in or Create an account to join the conversation.
- Peter Heckert
-
- Offline
- Junior Member
-
- Posts: 62
- Thank you received: 3
I tried now and it worked when the debug output window was undocked.
When I docked the debug output window, then sometimes I get longer delays, up to 20 seconds in some situations.
But it did not freeze forever or crash here.
This all on CT6.8. I know, they work on the debugger currently.
Possibly try this.
Possibly try it without debug outpt window or with this window undocked.
Please Log in or Create an account to join the conversation.
- universe
-
Topic Author
- Offline
- Junior Member
-
- Posts: 114
- Thank you received: 8
Please Log in or Create an account to join the conversation.