lz_PlotFunction Library with simple Chart components. Properties: BackColor This is the background color of the plotting area GridColor When you make this the same as Backcolor, the grid is invisible LayerOption For easy plotting of a single layer this can be set to False. It is not possible to set this to True directly (see methods) Margin The width of the border of the plot in pixels PlotMode Three plotmodes are possible: pmBar, pmLine and pmDot PlotPen Properties of the plotting pen. If LayerOption is False, then all sub-properties can be set. If LayerOption is True, then information about the plotting pen is transferred via the LayerOptions method (methods) Title The Title is at the top center of the plot and uses the Font property PlotBMP This is a bitmap holding the whole graph (see demo for its use) The X-axis properties: XLabel Label at the X-axis XMarks When True, the X-axis has marks XMarksFont Font used for the XMarks XMarksInterval Interval between to lines in the grid (applies for linear scales only) XMax Maximum value of X that is visible XMin Minimal value of X that is visible XScaleLog When TRUE the scale is logarithmic (the interval is determined by the component) For the Y-axis the same applies. Methods: AddXY(X,Y:Extended) With this method you can add points (or lines) to the plot Example for i:= -10 to 10 do [b]PlotPanel1.AddXY(i,i*i)[/b] This plots a parbola .The line is plotted with the PlotPen properties Note you can only plot a single layer. ................
The problem I have is when trying to use:
PlotPanel1.AddXY(........)
It Appears an Error Message:
Compile Project, Target: ........: Exit code 1, Errors: 1
........ Error: Identifier idents no member "AddXY"
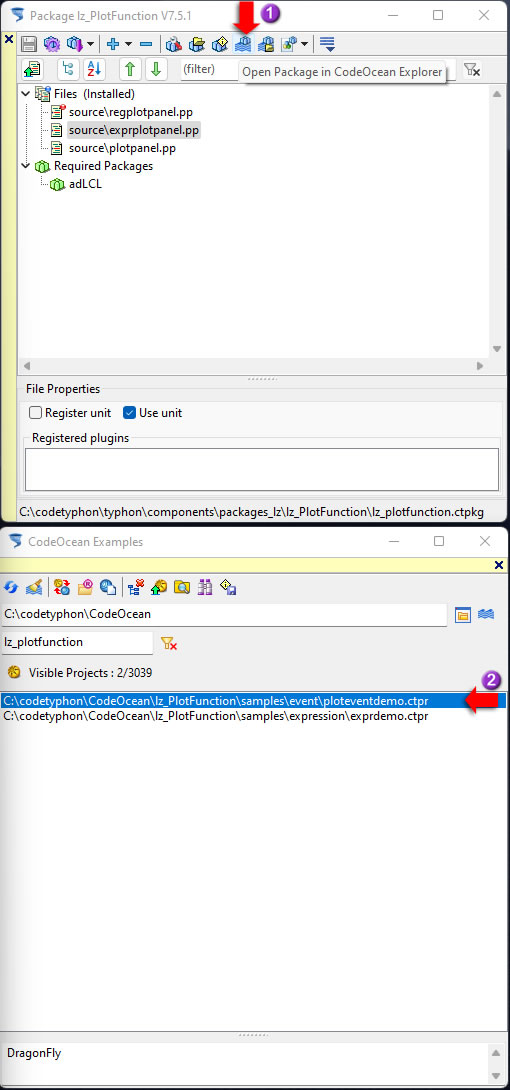
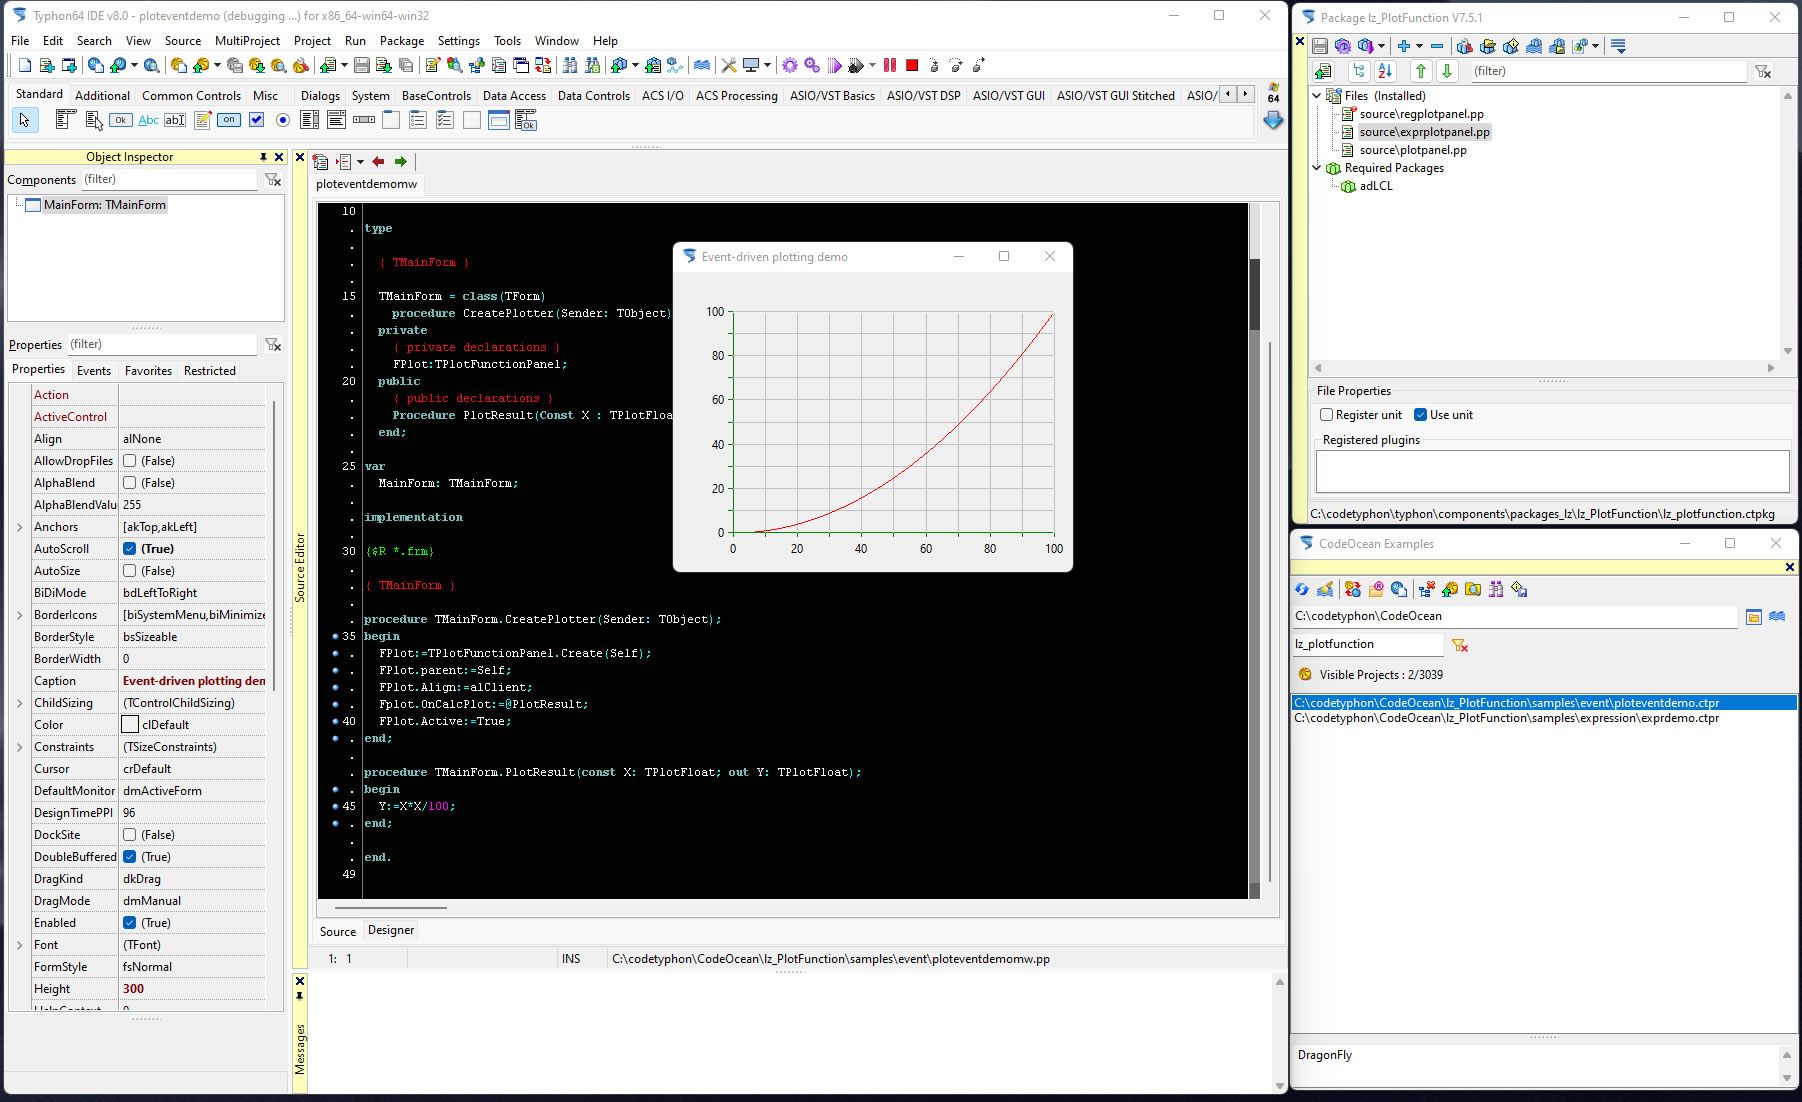
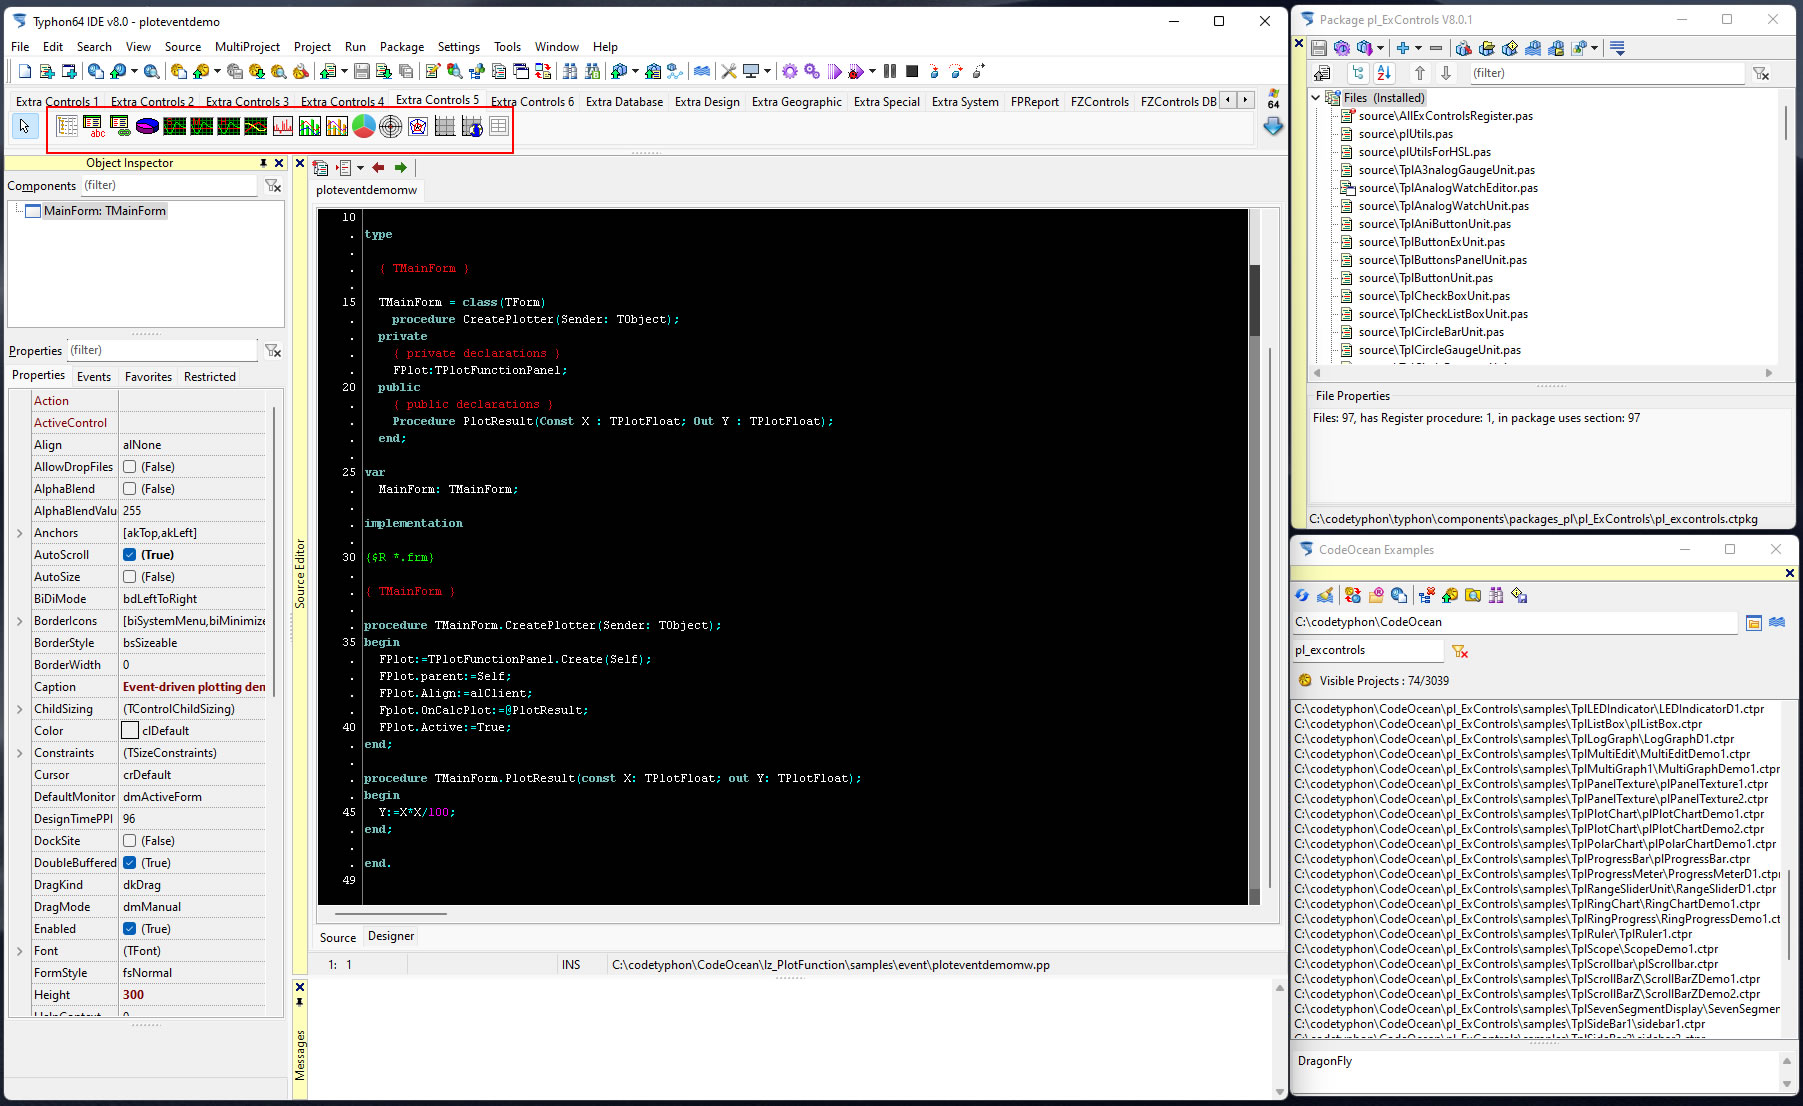
How to use a TPlotFunctionPanel Component ?